This article was co-created by Cathryn Greville, Head of Fairness, Inclusion & Respect, and Saira Khan, Fairness, Inclusion & Respect Conference & Outreach Officer.
On 18 October 2023, the Supply Chain Sustainability School recently held it’s Black and Ethnic Minority Experiences in the Built Environment Sector Conference. Part of the Fairness, Inclusion & Respect Programme offering, the virtual conference delved into the statistical difficulties that persist for individuals from Black and Ethnic Minority backgrounds when seeking employment and striving for career advancement within the built environment.
These challenges were illuminated through recent diversity research such as our Diversity Data Survey and FIR Culture Impact Survey. In bringing together the insights and experiences of industry leaders, professionals and thought leaders, we examined the collective responsibility to delve deeper, examine and understand the data, and most importantly, take action.
This article discusses the key insights and findings from the conference.
Importance of Data:
Both internal organisational data, and the data of those that organisations engage in their supply chain, is of critical importance in measuring, tracking and understanding the make-up of the workforce and stakeholders. Not only should we be striving for inclusion within our own businesses, but we should also be looking beyond that to everyone we engage with, and how we use our purchasing power. After all, the impact of a business extends far beyond its own walls, so to speak.
We used the opportunity to examine research both within the built environment sector, and beyond it, to make informed comparisons and shed further light on the issues requiring attention.
Set out below is a snapshot of key findings arising from that research.
 Findings relating to ethnicity from the 2022 Diversity Data Survey.
The Diversity Survey is the largest data capture exercise across the UK built environment sector. Unique in its ability to capture and analyse data from both organisations and their supply chains, the survey provides important insights into the state of the sector.
The 2022 Diversity Data Survey Results capture over 370,000 employees from over 270 companies, providing a substantial sample for analysis and benchmarking.
The 2022 results provide insights into the challenges faced by candidates and workers from ethnic minority backgrounds.
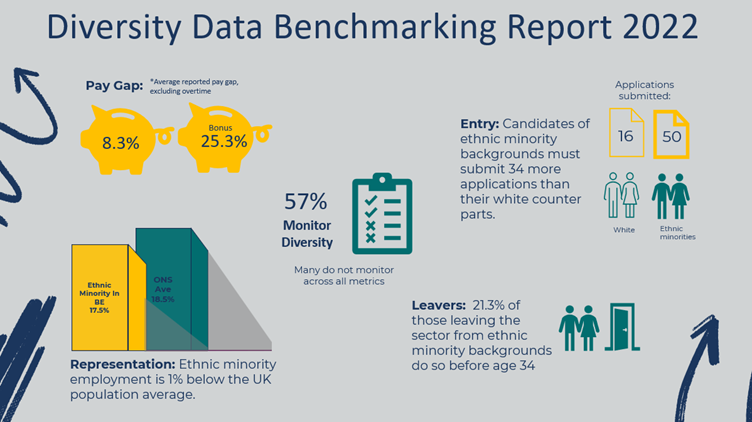
- Representation: Workers of ethnic minority backgrounds constitute 17.5% of the workforce, 1% less than the UK population which sits at 18.5% (ONS 2021 Census).
- Entry Challenges:Attraction and recruitment is a significant focus area. Among the 367,000 applicants represented in the data, close to 40% (39.3%) came from ethnic minority backgrounds. However, ethnic minority candidates face greater challenges in securing jobs in the sector. Across every ethnic minority group, it is harder to get a job than a white candidate. On average, it takes 50 ethnic minority candidates need to achieve an ethnic minority hire, whilst white candidates are hired at a rate of 16 candidates to 1 successful hire. However, this is an average across all ethnic minority groups, the actual success rate ranges from 21 candidates to 1 hire, to 78 candidatesto 1 hire. Ultimately, it is between 3 to 5 times harder for ethnic minority candidates to get a job.
- Pay Gap: For those who do achieve a role in the sector stand to face an ethnic pay gap of 8.3% – that is, staff from ethnic minority backgrounds earn on average 8.3% less than their white counterparts. This gap extends to bonus pay, where workers from ethnic minority backgrounds receive 25.3% lower bonuses compared to white workers. However, the sector needs to significantly improve its capture and reporting on ethnicity – only 4% of organizations currently do so, with 28% intending to do so in the future, that leave the large majority (68%) who neither capture this data or intend to do so.
- Monitoring: A significant improvement is also required with respect to monitoring diversity. We found that only 57% of organizations actively monitor diversity internally, with even fewer tracking diversity within their supply chains. Without access to diversity data and the analysis that can be drawn from it, it is difficult for organisations to identify issues and address disparities. It is also impossible to track the impact of diversity initiatives.
- Leavers (Attrition): Our survey captured almost 20,000 people leaving their jobs. Approximately 17.7% of voluntary leavers came from ethnic minority backgrounds, roughly in alignment with 17.5% representation of the total workforce. However, there is limited data available on the ethnicity of leavers. We do know that the majority of leavers are Indian (21%), African (13.5%) and to similar extents Other Asian and Pakistani (approximately 9% each). A higher proportion come from other diversity categories, in particular women, LGBTIQ+ and other religions. Alarmingly, 21.3% of those leaving the sector from ethnic minority backgrounds leave before the age of 34.
2023 FIR Culture Impact Survey.
Overview of findings relating to ethnicity from our 2023 FIR Culture Impact Survey.
The 2023 FIR Culture Impact Survey focuses on the impact of initiatives and activities related to the FIR Programme in the built environment sector. Key findings include:
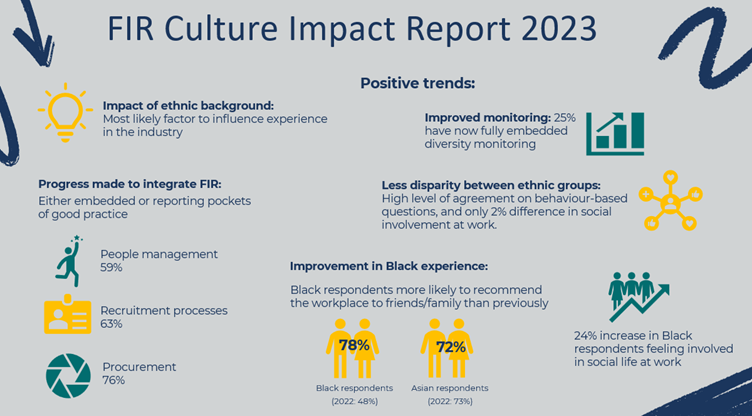
- Impact of ethnic background: Interestingly, the survey reveals that ethnic background is the factor most likely to influence an individual’s experience in the industry.
- Positive trends: Advancement is being made, with 25% of participants having fully embedded diversity monitoring into their companies, and 55% making progress towards this goal.
- Less disparity between ethnic groups: In a number of areas, there is little difference among White, Black, and Asian respondents. For example, we see a high level of agreement on behaviour-based areas such as feeling treated fairly at work, feeling comfortable to be onself and being comfortable with how people speak and behave at work. In terms of social involvement at work, there is only 2% separating the experiences fo White, Black and Asian respondents.
- Improvement in Experiences: We found substantial improvement in terms of increased likelihood of Black respondents recommending the workplace to friends or family – up 30% to 78% of respondents likely to make this recommendation (from 48% in 2022). The experience of Asian workers over the same period remained steady (72%).
- Integration of FIR: Encouragingly, we are also seeing progression in how organisations are integrating FIR into their practices, with more integration in people management, recruitment processes, and procurement.
Key Takeaways:
- We need further progress to achieve proportionate representation, but representation is only a start.
- A focus on the quality of jobs is needed – the significant pay gap indicates Black and ethnic minority workers are earning less overall and occupying fewer senior positions.
- Black and ethnic minority candidates are certainly attracted to the sector – the issue is the impediments they face securing jobs.
- Organisations need to review business and team practices and upskill everyone involved in recruitment process to truly embed inclusive hiring practices.
- Culture is critical – we need to ensure we retain Black and ethnic minority talent and see them grow and advance in their careers (particularly the younger generation). This requires a positive work environment, psychological safety and due recognition.
- Monitoring diversity is an essential step to creating a more equitable and inclusive work environment.
Examination of UK Employment Data
Overview of facts and figures from UK-wide research into ethnicity and employment.
We also examined research regarding ethnic employment disparities in the wider UK landscape.
Comparing internal and external data is essential for our diversity and inclusion efforts in the Built Environment sector. While our internal data helps us understand our own practices, external data provides a broader view. It lets us see how we’re doing compared to others in the industry, confirms if our efforts are effective, and highlights important issues we may miss otherwise. This comparison not only helps us make progress and inspire industry-wide change but also reminds us that diversity and inclusion are responsibilities shared by the entire sector, not just individual organisations. During our conference we did look at both types of data focusing on ethnic employment disparities in the wider UK landscape to compare with our data on the built environment, below is what we examined:
Ethnicity Pay Gap:
- The UK’s ethnicity pay gap is a significant issue, with disparities existing across most ethnic groups.
- A 2020 report by Tom Evans from the Office for National Statistics (ONS) analysing the Annual Population Survey (APS) and the Annual Survey of Hours and Earnings (ASHE) shows that, while some improvements have occurred, the ethnicity pay gap persists.
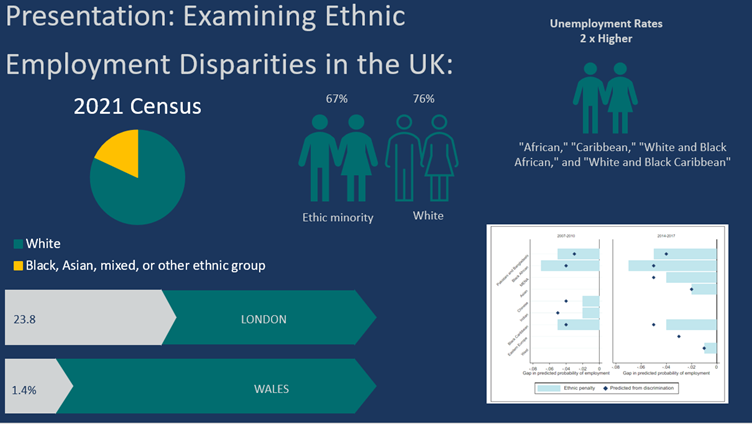
- Notably, these disparities vary by age and location. The gap is more prominent for those aged 30 and over compared to those aged 16 to 29, and it varies by region, with the highest gap in London (23.8%) and the lowest in Wales (1.4%).
- Evans’s 2019 report emphasises that factors like location, age, and ethnicity often intersect, leading to complex wage disparities that are interconnected and contribute to employment disparities among ethnic groups.
Pay gaps, including the ethnicity pay gap, have profound implications for individuals’ financial security, well-being, and quality of life.
Workplace Discrimination and Bias:
- Regarding workplace discrimination and bias, they are significant factors contributing to ethnicity pay gaps and discrimination for ethnic minorities.
- A study titled “Ethnic Penalties and Hiring Discrimination: Comparing Results from Observational Studies with Field Experiments in the UK,” conducted by researchers including Dr. Wouter Zwysen, Dr. Valentina Di Stasio, and Professor Anthony Heath, reveals troubling findings. Ethnic minorities in the UK face higher unemployment rates due to employer bias, known as ‘Ethnic Penalties.’
- The study concludes that employers are more likely to reject job applications from individuals with names suggesting non-white ethnicity. Field experiments showed that candidates with ethnic-sounding names were less than half as likely to be invited for job interviews.
- It’s important to note that ethnic discrimination levels vary among different minority groups. A 2022 report from the Office for National Statistics showed that Chinese and Indian minorities tend to face fewer barriers, possibly due to stronger social networks.
- However, hiring discrimination is pervasive across all ethnic minority groups, affecting not only job opportunities but also career advancement and job satisfaction.
- These implications contribute to the ethnicity pay gap and hinder career progression and job satisfaction.
These findings underscore the urgent need to address workplace discrimination and bias, which has far-reaching consequences affecting individuals in various ways.
Key Findings:
- Our exploration of ethnic employment disparities across the UK, covering all sectors, reveals a multifaceted challenge extending beyond statistics.
- The ethnicity pay gap is a nationwide issue, with consideration needed for how different characteristics intersect.
- Discrimination and bias contribute to reduced opportunities for ethnic minorities across all sectors in the UK.
- While UK-wide data suggests better outcomes for Chinese and Indian minorities, the Diversity Data findings for the Built Environment sector tell a different story. Indian candidates face challenges in construction, requiring 74.1 applications to secure one successful hire. This highlights the need for specific and in-depth research to understand sector-specific bias better.
Our recent conference highlighted the crucial need to blend internal and external data for advancing diversity and inclusion in the Built Environment sector. The 2022 Diversity Data Benchmarking Report revealed the industry’s diversity challenges, emphasising recruitment difficulties, pay gaps, and inadequate monitoring. The 2023 FIR Culture Survey showed positive trends and diversity programme integration. Additionally, external data exposed the persistent ethnicity pay gap in the UK, influenced by age, location, and ethnicity. Discrimination and bias in the workplace contributed significantly to these disparities, necessitating urgent attention. In summary, our conference has shed light on the challenges and opportunities in achieving diversity and inclusion in the Built Environment sector. It’s clear that there’s work to be done, but with continued efforts, we can create a more inclusive industry for all.
Resources
Diversity Data Benchmarking Report 2022
Diversity Survey – further details on how to participate.
Ethnicity facts and figures – Employment
Commission on Race and Ethnic Disparities Report
England and Wales’ Census 2021 – Ethnic group differences in health, employment, education and housing
Ethnic, Religious and Gender Differences in Intragenerational Economic Mobility in England and Wales